SCADA Observability for Electric Utilities
Catch grid faults
before the outage call
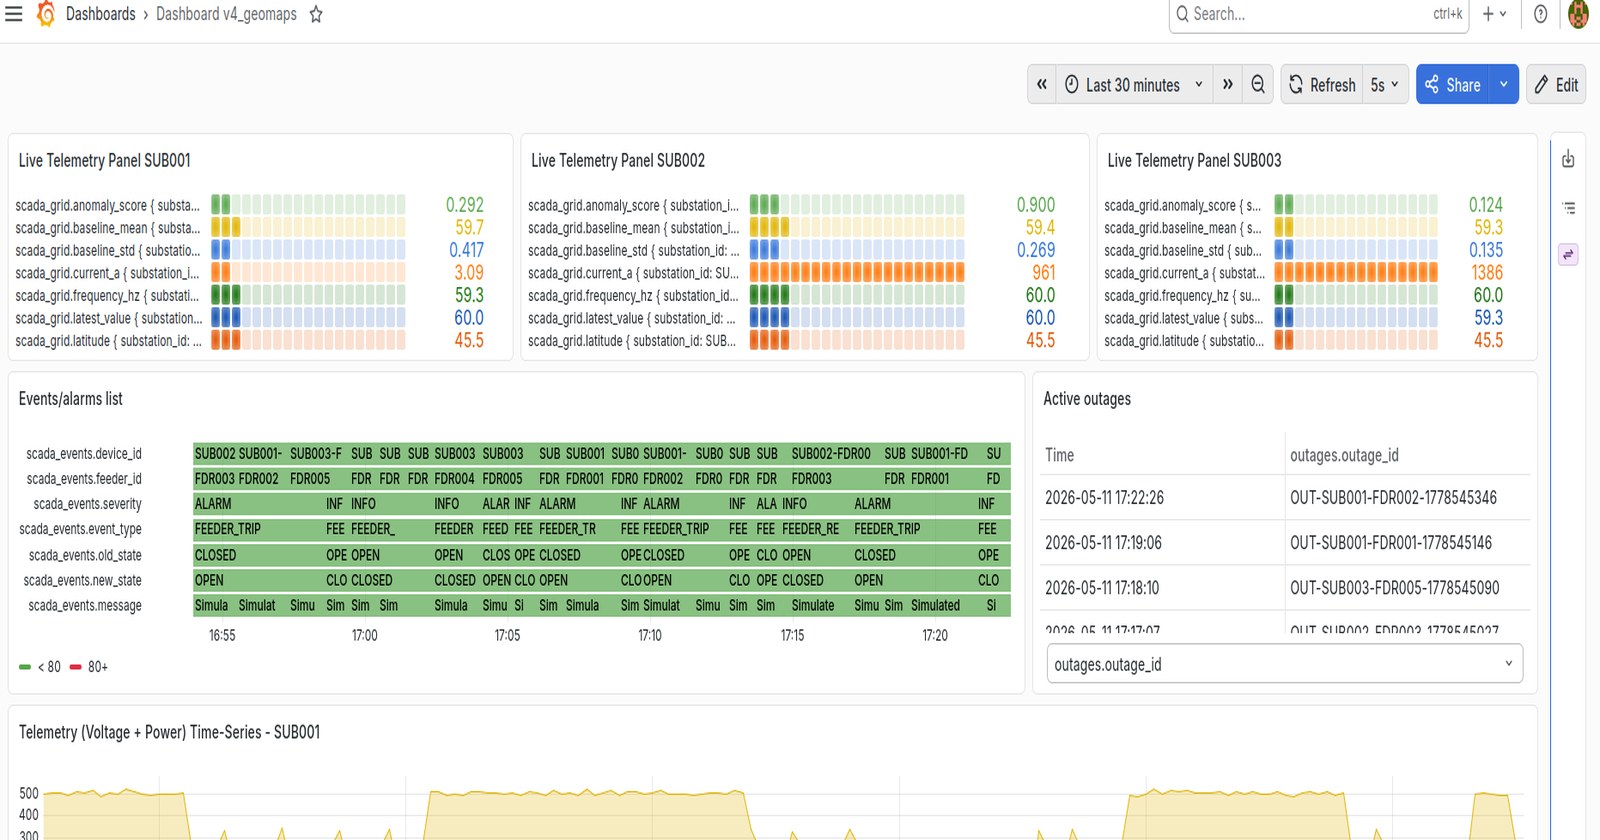
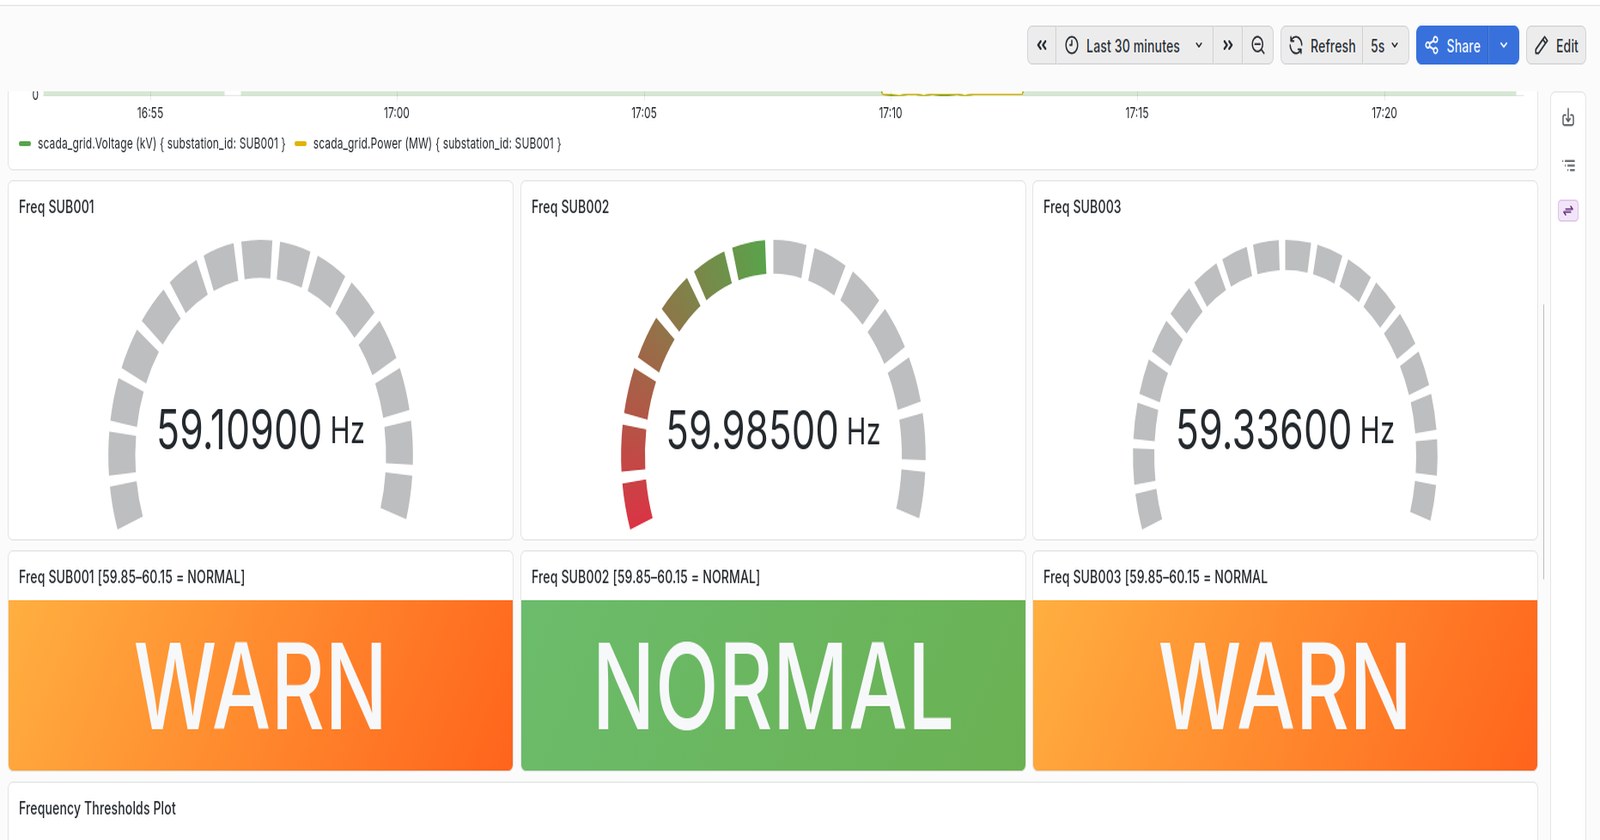
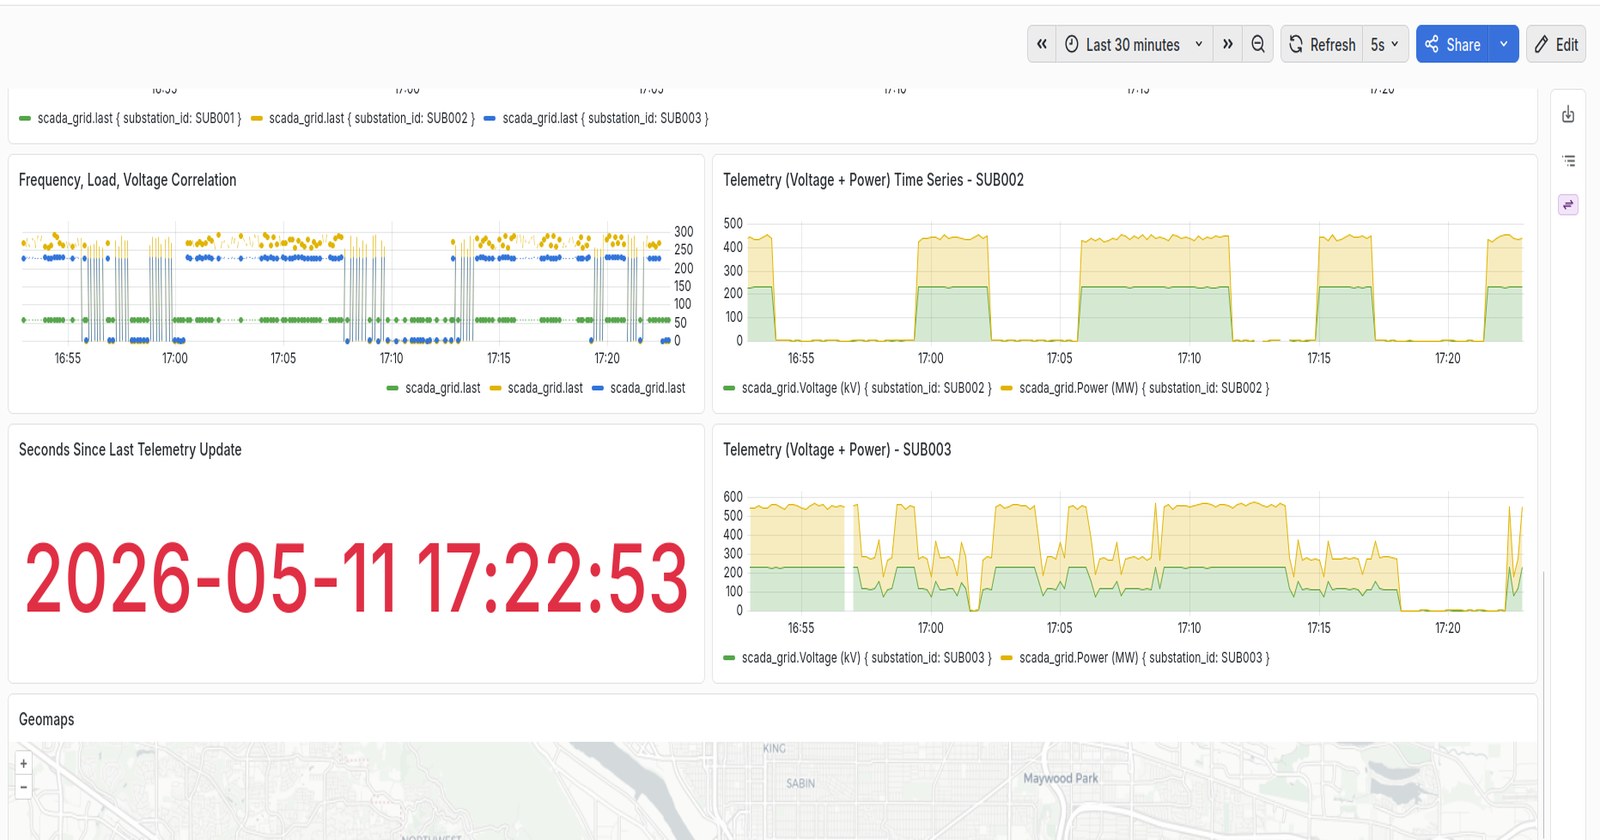
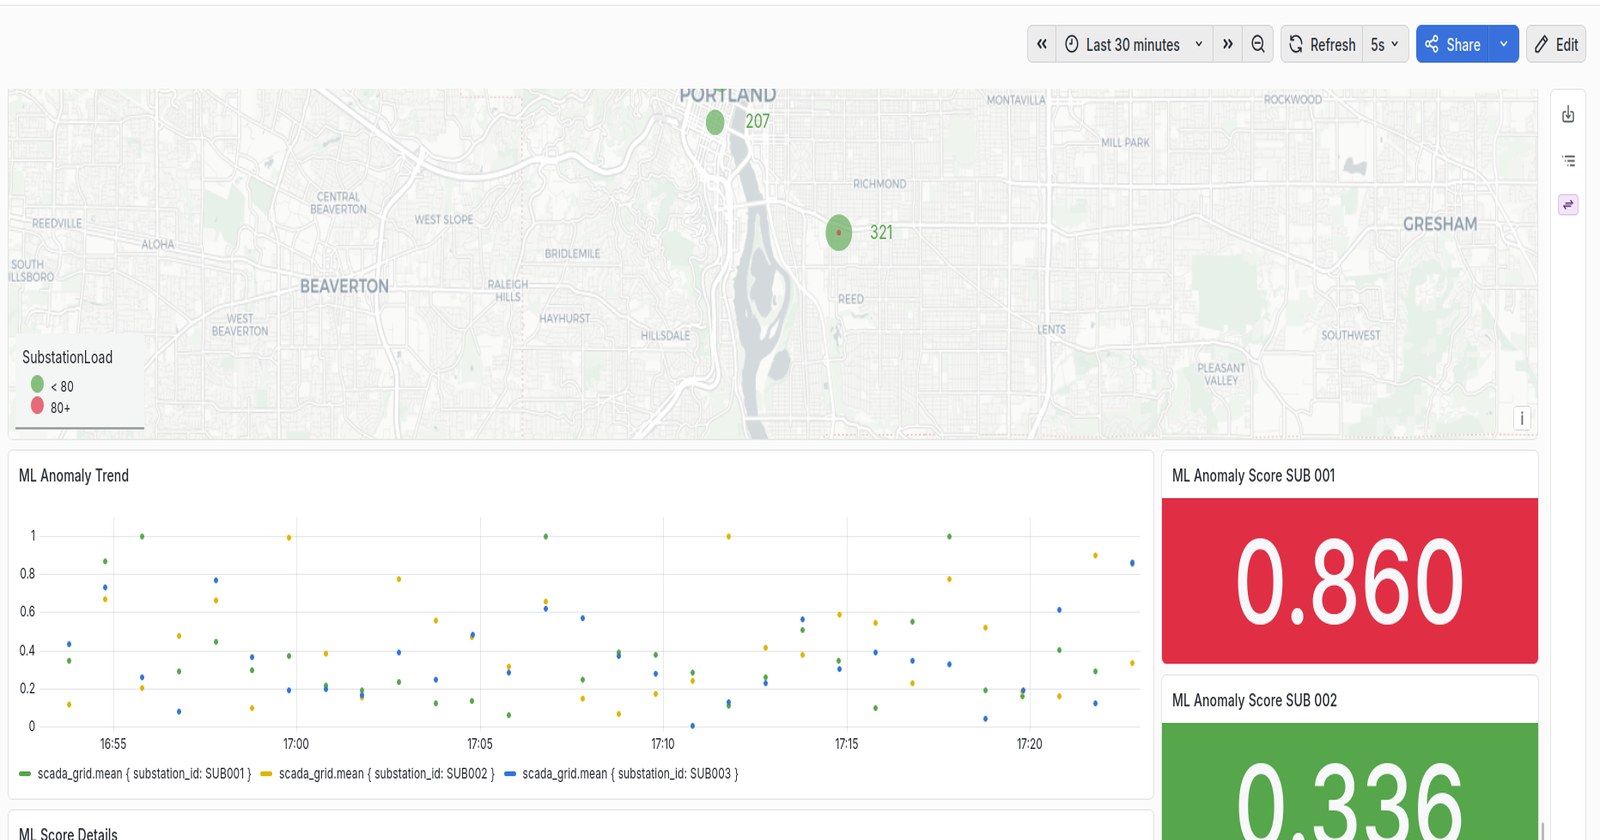
HOP Sensors gives your operations team live substation telemetry, ML anomaly detection, and outage tracking — all in a secure, role-based portal refreshed every 5 seconds.