Every substation.
Every second.
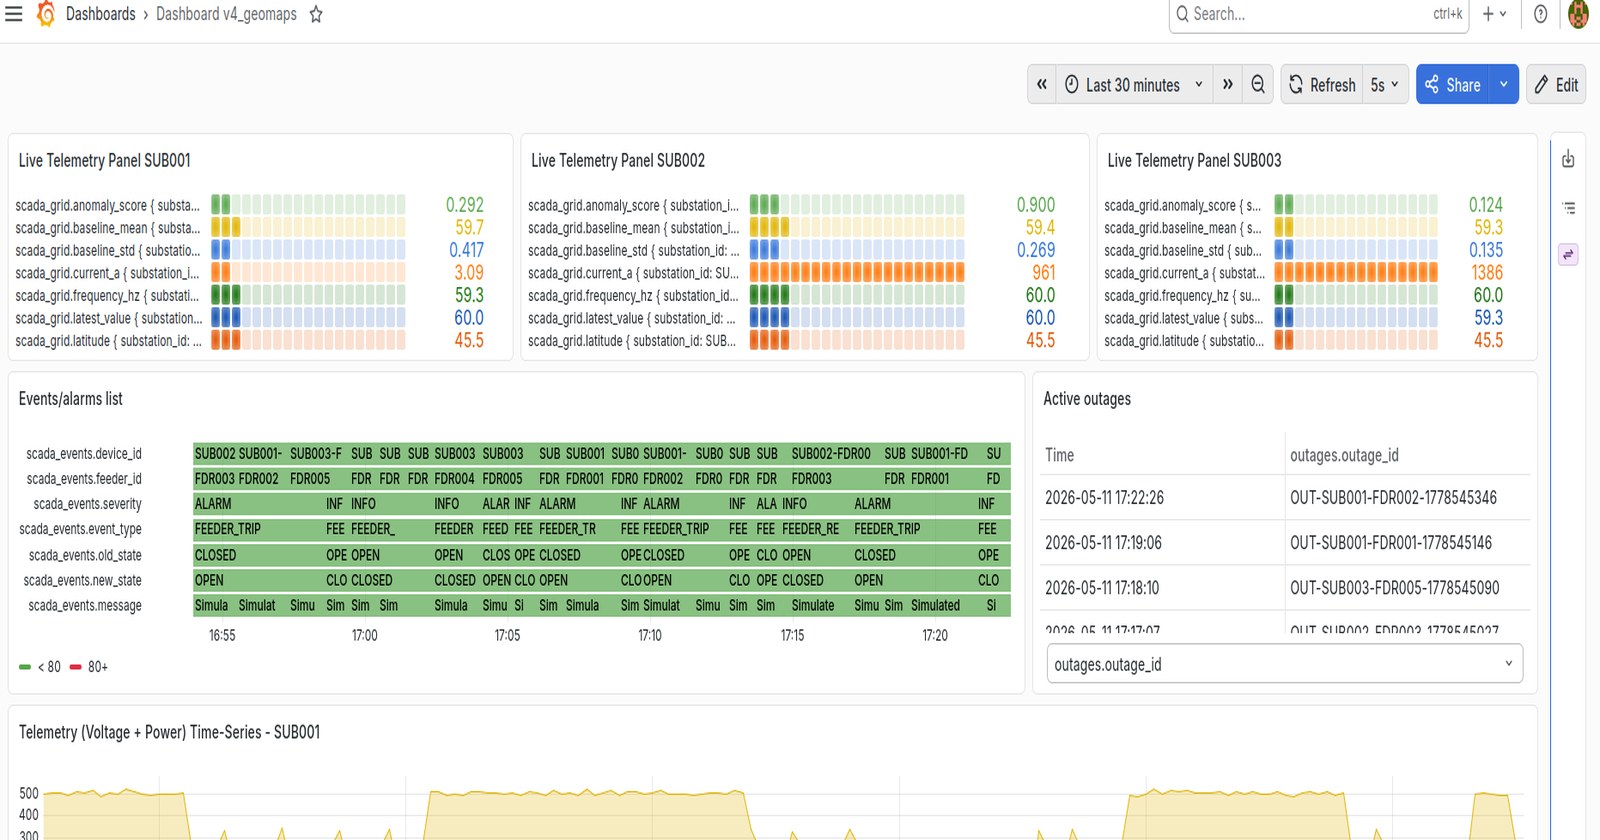
HOP Sensors streams telemetry from all your substations simultaneously, refreshing every 5 seconds. A single unified view shows anomaly scores, baseline means, frequency, voltage, current, and load — no switching between systems, no manual polling.
- 5-second refresh rate — continuous streaming, not polling
- Multi-substation panels — SUB001 through SUBn in one view
- Anomaly score per substation — 0.0 to 1.0, computed continuously
- Baseline mean & std dev — always visible, always current
- Voltage, current, frequency, power — all key grid parameters
Grid frequency.
Instantly visible.
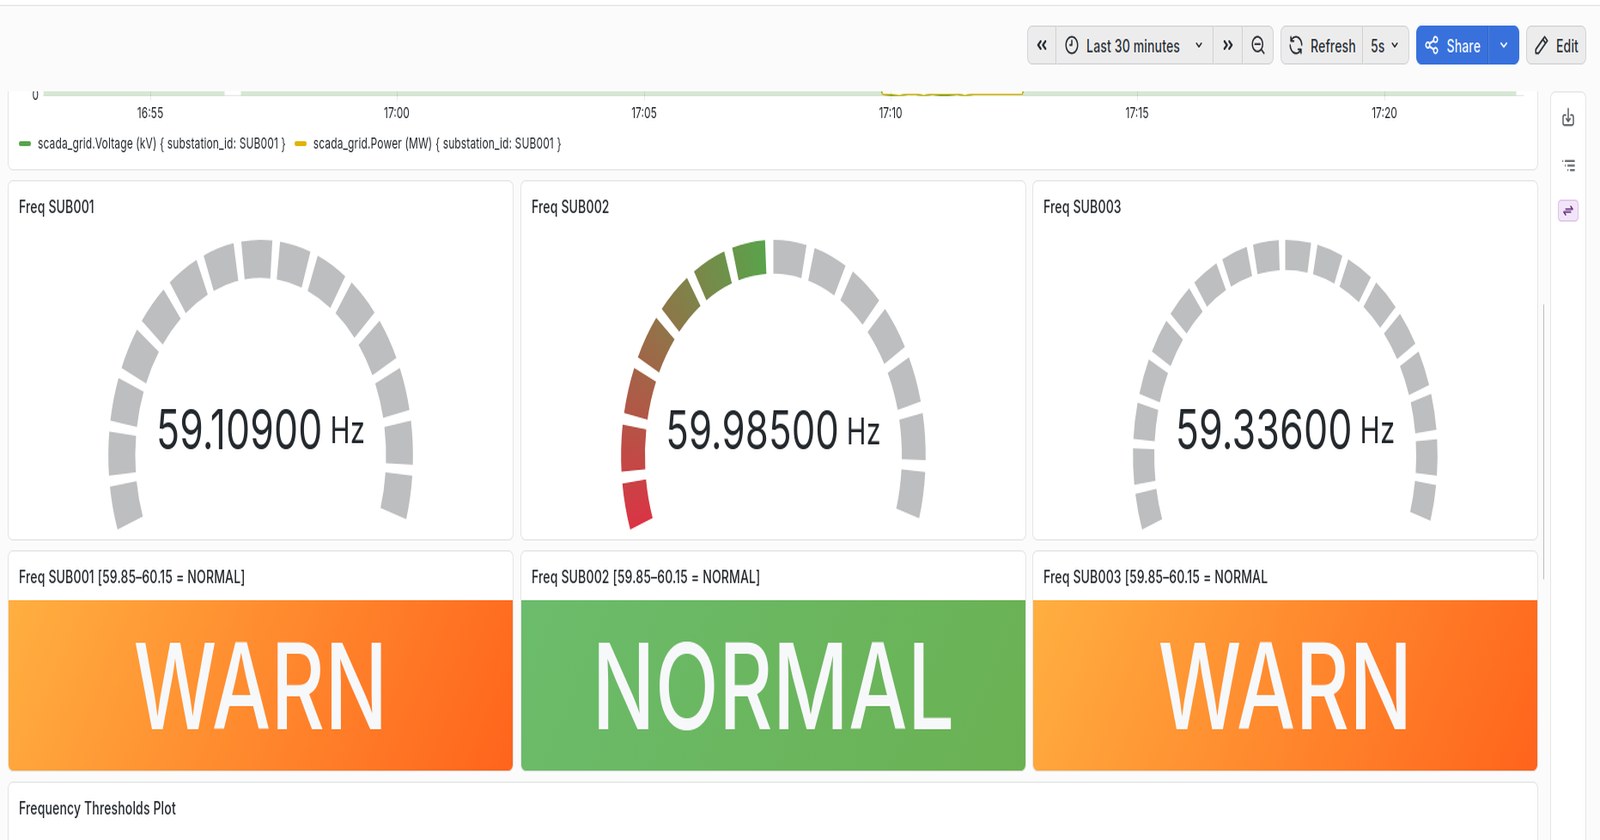
The North American grid standard is 60 Hz. Deviations signal stress, generation imbalance, or imminent failure. HOP Sensors gives every substation its own live frequency gauge with configurable WARN and NORMAL thresholds — so your ops team always knows where frequency is drifting before it becomes a NERC incident.
- Per-substation frequency gauges — not a grid average, but per-site readings
- WARN / NORMAL status banners — color-coded, impossible to miss
- Configurable thresholds — default 59.85–60.15 Hz, fully adjustable
- Frequency threshold plot — historical drift for all substations overlaid
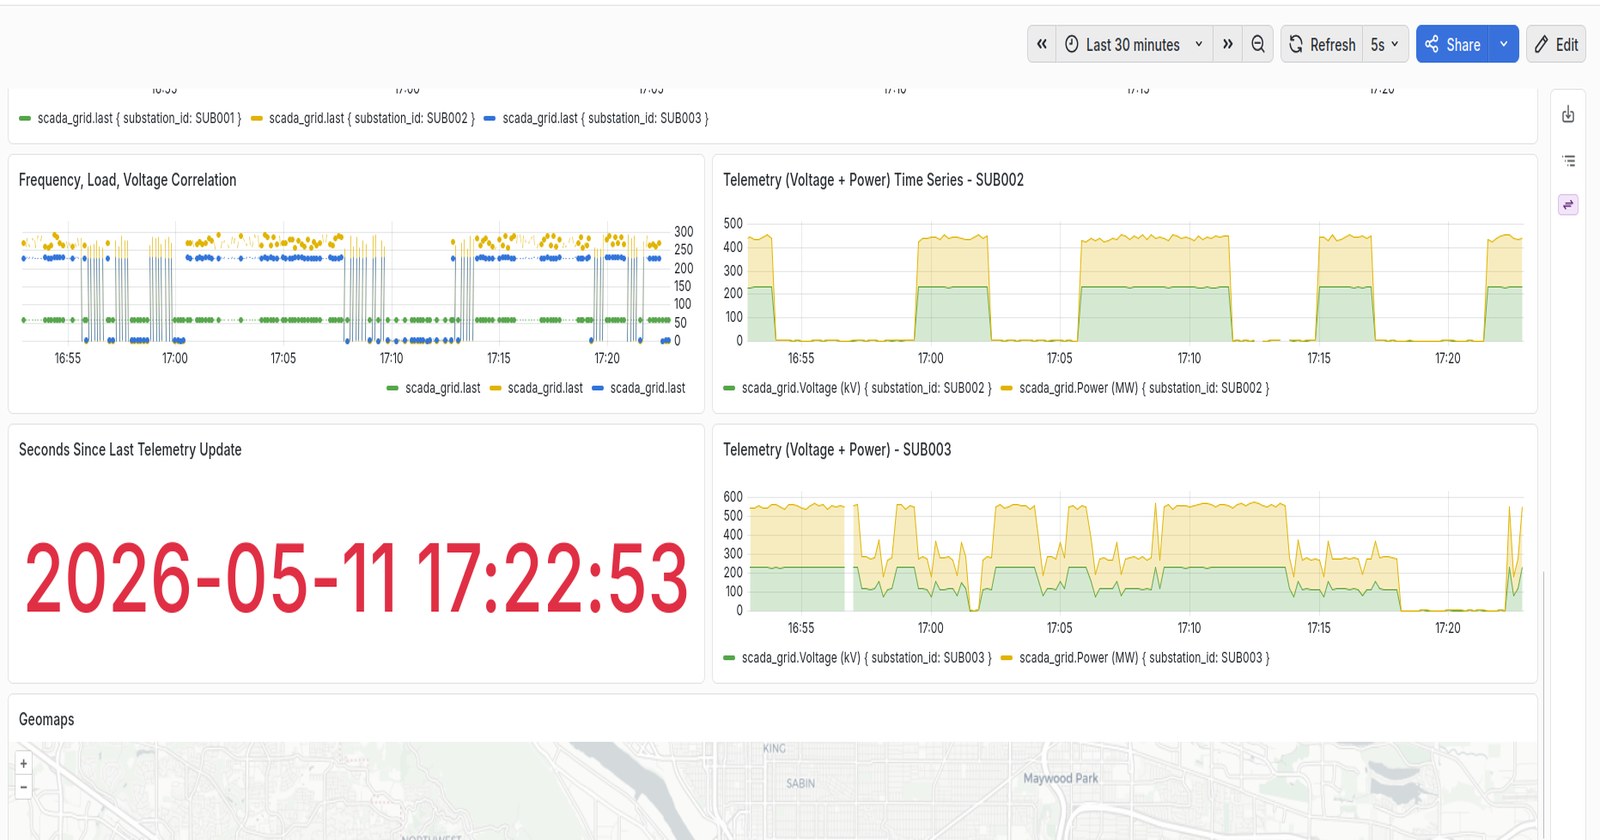
- Frequency, Load, Voltage correlation — see relationships at a glance
Anomaly detection with
no black boxes.
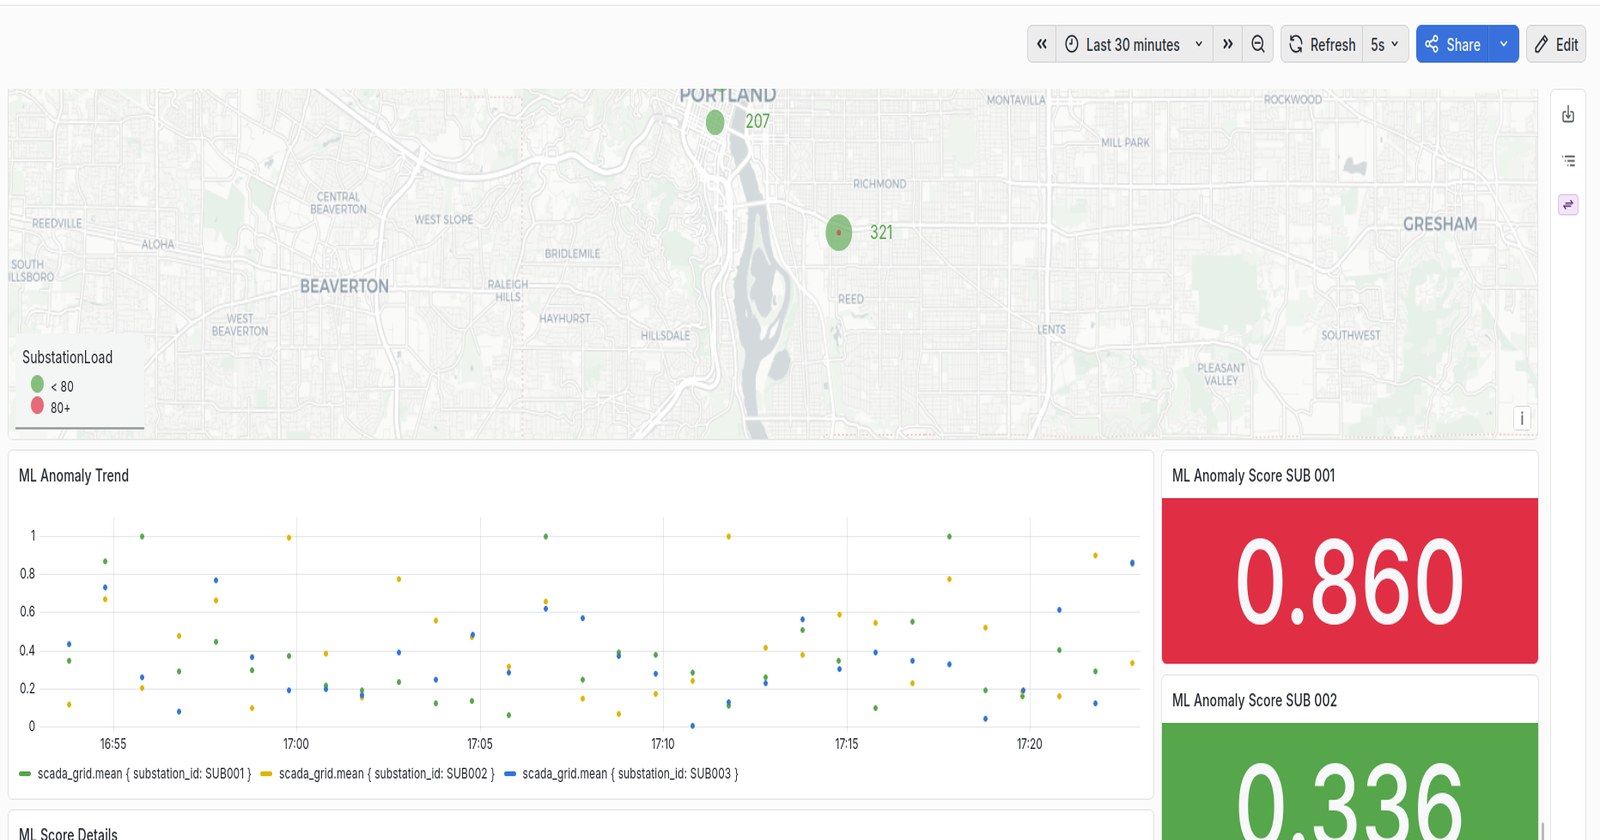
Most ML anomaly systems give you a score and a red light. HOP Sensors gives you the score, the Z-score, the baseline mean, the baseline standard deviation, the Is_Anomaly flag, and the full per-substation audit table. You see exactly why the model flagged something. No mystery, no vendor lock-in on model behavior.
- Per-substation ML models — trained on each site's own historical baseline
- Continuous scoring — every telemetry update triggers a new score
- Z-score exposure — full statistical transparency
- Is_Anomaly flag — binary classification with configurable threshold
- ML Anomaly Trend plot — score history across all substations
- Full audit table — every reading, every score, exportable
See your grid.
On the map.
A live geographic map of every substation in your service territory, with load status indicators. When an outage occurs or anomaly is detected, see it geographically — not just as a row in a table. Know instantly which neighborhoods are affected, which feeders are involved, and which sites are adjacent.
- Live substation markers — color-coded by load status
- Load threshold indicators — green (<80%), red (80%+)
- Click-through to substation detail — one click from map to telemetry
- Service territory overlay — visualize your full coverage area
EVENTS / ALARMS LIST
Every event.
Every feeder.
HOP Sensors automatically captures state transitions across all feeders — FEEDER_TRIP, OPEN, CLOSE, ALARM, INFO — and correlates them into a live events list. Active outages get their own panel with outage IDs, timestamps, and affected feeder details.
- Live events/alarms list — all feeders, all substations, unified
- State transition capture — OPEN → CLOSED, TRIP → RESET
- Active outages panel — current outages with IDs and timestamps
- Full event history — audit-ready, timestamped to the second
- Severity classification — ALARM, INF, WARN levels
VOLTAGE (kV) + POWER (MW) — SUB001
Historical context.
For every reading.
Every telemetry value is backed by a full time-series history. Voltage and power time-series plots let you see not just where your grid is now, but the trajectory that got it there — essential for distinguishing normal operational variation from developing faults.
- Voltage + Power overlay — dual-axis time series per substation
- Configurable time window — last 5 min to last 30 days
- Auto-refresh — live updates while you watch
- Cross-substation comparison — overlay multiple sites
- Export-ready — pull raw data for reporting or analysis